- Last edited on February 1, 2024
Introduction to Statistics and Epidemiology
Primer
Statistics and Epidemiology in Medicine is important for clinicians to understand. There can often be a difference in clinical outcomes seen in patients in clinical trials, compared to real-world, community settings. Clinical trials usually exclude patients with multiple diagnoses or comorbidities, whereas in the real world, patients have multiple diagnoses and conditions all the time. This disconnect means it can be challenging for clinicians to interpret the efficacy of treatments from clinical trials, systematic reviews, and meta-analyses.[1] Having a solid understanding of statistical principles can allow you to critically appraise the literature and understanding whether you should trust a study or not!
Statistics Basics
Measurement
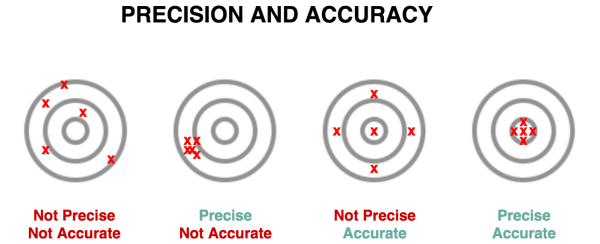
- Reliability = Precision/Replicability
- Validity = Accuracy
- Is the degree to which a measurement is concordant with “the true value”?
- Many different types validity, but it all relates how a test measures what it purports to actually measure
- Responsiveness = Sensitivity of measurement to a change in a patient's clinical condition
- Interpretability = Meaning of a given score (e.g. > 10 on the PHQ-9 suggests depression)
Validity
There are 4 types of validity:
- Face validity: Does this seem like it makes sense?
- Content validity: Extent to which a measurement includes all of the concepts of the intended construct, but nothing more
- e.g. - PHQ-9 needs to include all criteria for depression, but shouldn't include criteria for autism
- Construct validity: Is the measurement related coherently to other related (but not observable) constructs?
- e.g. - If a new scale for depression was completely unrelated to a scale that measures energy and concentration levels, you would be concerned about the validity of this new scale (since energy and concentration are two of the criteria for depression)
- Criterion validity: the extent that the measures predict readily observable phenomena
- e.g. - Is the score on the pain scale related to how much pain medication the patient requests?
Finally, you should also think about the relationship between a diagnostic test and the actual presence of disease, as determined by: sensitivity, specificity, positive predictive value, and negative predictive value.
Type I and Type II Errors
In every research study, there is something called the null hypothesis. This means the default outcome of every study assumes there is no statistical significance between the two variables (e.g. - no relationship between smoking and risk of lung cancer) that you are looking at in your study. In most studies, a researcher or experimenter will try to disprove or discredit the null hypothesis (e.g. - the researcher will try to prove there is in fact a risk between smoking and lung cancer).
When one rejects or fails to reject the null hypothesis correctly, two types of errors can occur:
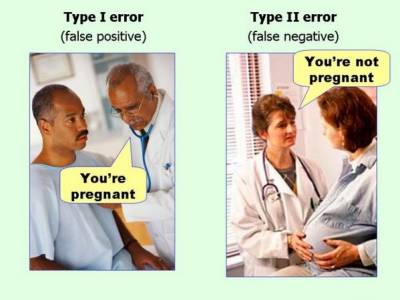
- Type I error (False Positive) is when the investigator rejects a null hypothesis that is actually true in the population
- Type II error (False Negative) is when the investigator fails to reject a null hypothesis that is actually false in the population
Rhyme to Remember What Type I and Type II Errors Are
Think like an “evil Big Pharma” drug company that is trying to market a drug:- Type I Error = “Type I? We have won!!”
- i.e. - you have a false positive, this means the drug doesn't work in real life, but by chance/error the study shows it does.
- Type II Error = “Type II? What to do?!”
- i.e. - you have a false negative, this means the drug really does work in real life, but the study (falsely, by statistical chance) shows it doesn't work!
Study Findings
If you were looking at a study looking at the association between smoking and lung cancer, you would apply the following table below to look at the probability of a Type I and Type II error.
Type I and II Errors: Study Findings
| Positive Finding in Real World | Negative Finding in Real World | |
|---|---|---|
| Positive Finding in Study | (a) True Inference | (b) 👻 False Positive (Type I Error) |
| Negative Finding in Study | (c) 👻 False Negative (Type II Error) | (d) True Inference |
Medical Tests
If you were looking at a study looking at how good a test was at detecting lung cancer, you would apply the following table below to look at the probability of a Type I and Type II error.
Type I and II Errors: Medical Tests/Investigations
| Diseased in Real World | Non-Diseased in Real World | |
|---|---|---|
| Positive Test Result | (a) True Positive | (b) 👻 False Positive (Type I Error) |
| Negative Test Result | (c) 👻 False Negative (Type II Error) | (d) True Negative |
Sensitivity and Specificity
Sensitivity and Specificity are fixed properties of a test and their values never change:
- For sensitivity (the “true positive rate”), you are interested in knowing how many people with disease you are able to identify with your test. To determine sensitivity, you need to compare the number of patients who were identified as having the disease, compared to the number of patients who actually have the disease:
- A highly sensitive test rarely misses people with the disease and rarely has false negatives
- You want high sensitivity in a test when it is really bad to miss a disease (e.g. - brain cancer)
- A highly
Sensitive test whenNegative rulesOUTthe disease (SNOut)
- For specificity (the “true negative rate”), this concept is slightly less intuitive, even though the equation is equally simple compared to sensitivity. Remember that with sensitivity, we focus on the patients who have disease. With specificity, we focus on the patients who do not have disease.
- Thus, a test that has high specificity will not identify healthy patients as having disease. With a highly specific test, we would expect that there are a lot of true negatives and only a small amount of false positives (or even better, none at all!).
- When we talk about specificity, we are interested in the proportion of people without disease who have a negative test.
- A highly specific test rarely will rarely give false positives
- You want a highly specific test when a false positive result might be harmful to the patient (e.g. - there is some debate that mammography in young women might not be highly specific for breast cancer, and place these patients at risk for further invasive procedures like biopsies and unnecessary psychological stress.)
- A highly
Specific test whenPositive rulesINthe disease (SPIn)
A Non-Mathematical Example
Imagine you have a car with an alarm. In an ideal world, your car alarm will only trigger if someone tries to break into it, and would never be triggered by anything else. You have a dial where you can adjust the threshold for your car alarm.Since you have a very fancy car, you initially set a low threshold for your car alarm to activate, so it activates even when a small vibration sets it off. In this case, your alarm is very sensitive, since every little movement will trigger it. However, is is not very specific, meaning even non-break in activities will set it off.
After being frustrated by the alarm going off all the time, you now set a high threshold for your alarm. Now your car is very specific for break-ins only. Unfortunately, your car was broken into twice, and it only went off once. Your alarm is thus, not very sensitive, since it missed 50% of the break ins.
In an ideal world, you would have a car alarm that is very sensitive and very specific, perhaps even 100% sensitive and 100% specific. Unfortunately, such a perfect car alarm does not exist. The same is true of medical tests and screening tools.
In An Ideal World...
In an ideal world involving a low prevalence disease, one would want a high sensitivity screening test, that picks up all possible cases first. Then, one would want a high specificity confirmatory test that would for sure rule in the disease.Sensitivity and Specificity
| Diseased in Real World | Non-Diseased in Real World | |
|---|---|---|
| Positive Test Result | True Positive (TP) | False Positive (FP) |
| Negative Test Result | False Negative (FN) | True Negative (TN) |
| Measure | Sensitivity = (TP) ÷ (TP+FN) | Specificity = (TN) ÷ (FP+TN) |
High/Low Sensitivity and Specificity
| Sensitivity | Specificity | Interpretation |
|---|---|---|
| High | Low | If our test has a high sensitivity but a low specificity, the test will be very good at finding all the disease because it is sensitive. BUT, it will also be easily tricked into thinking the disease is there when it is not because it is not very specific. Our results will show a lot of true positives (which is good), but also a lot of false positives (which is bad). |
| Low | High | If the test has low sensitivity but high specificity, when we get a positive result, we can be pretty sure that the disease is present. However, if we have a negative result, we can’t be too sure that we have a healthy patient because maybe the test was not sensitive enough to pick up the disease in that particular patient. This type of test is thus most helpful to us when it gives a positive result, because we can be pretty confident that the patient has the disease for sure. |
Positive and Negative Predictive Value (PPV and NPV)
Positive Predictive Value (PPV) and Negative Predictive Value (NPV) are another two concepts that relate to Type I and Type II errors:
- Positive predictive value (PPV): probability that someone who has a positive test result actually has the disease.
- The PPV varies directly with patient's pretest probability of having said disease (i.e. - their baseline risk)
- Negative predictive value (NPV): Probability that someone who has a negative test result actually does not have the disease.
- The NPV varies inversely with prevalence of the disease or with patient's pretest probability of having said disease
Positive Predictive Value (PPV) and Negative Predictive Value (NPV)
| Diseased in Real World | Non-Diseased in Real World | Measure | |
|---|---|---|---|
| Positive Test Result | TP | FP | Positive Predictive Value = (TP) ÷ (TP+FP) |
| Negative Test Result | FN | TN | Negative Predictive Value = (TN) ÷ (FN+TN) |
| Measure | Sensitivity = (TP) ÷ (TP+FN) | Specificity = (TN) ÷ (FP+TN) |
Accuracy
Accuracy is the final concept related to Type I and Type II errors, and can be calculated below.
Accuracy
| Diseased in Real World | Non-Diseased in Real World | Measure | |
|---|---|---|---|
| Positive Test Result | TP | FP | Positive Predictive Value = (TP) ÷ (TP+FP) |
| Negative Test Result | FN | TN | Negative Predictive Value = (TN) ÷ (FN+TN) |
| Measure | Sensitivity = (TP) ÷ (TP+FN) | Specificity = (TN) ÷ (FP+TN) | Accuracy = (TP + TN) ÷ (TP + FN + FP + TN) |
Prevalence vs. Incidence
The terms prevalence and incidence are often used incorrectly in describing how common a disease or disorder is. Here are the correct definitions:[2]
- Prevalence: looks at ALL existing cases of an illness or disease. Think about looking at a photo of 1,000 people (the population), and asking, how many people have black hair? The number of individuals with that feature is used to calculate prevalence.
- Prevalence can also be calculated from a 2×2 table
- Prevalence = (TP + FN) ÷ (TP + FN + FP + TN)
- There are 3 ways to express prevalence:
- Point prevalence: The number of cases at a certain time (e.g. - a survey on December 2020 asking if you are actively smoking).
- Period prevalence: The number of cases over a certain time frame, usually 12 months (e.g. - a survey asking if you have smoked between January 2020 to December 2020)
- Lifetime prevalence: The number of cases over one's total lifetime. (e.g. - a survey asking if you have ever smoked in your life)
- Incidence: Incidence looks at the number new cases over a period of time. For example, in 1,000 people, if 50 were diagnosed with lung cancer over 2 years, the incidence is 50 cases per 1,000 persons, or 5.0% over a two year period, or 25 cases per 1,000 person-years (incidence rate) – because the incidence proportion (50 per 1,000) is divided by the number of years (2).
Prevalence
| Diseased in Real World | Non-Diseased in Real World | Measure | |
|---|---|---|---|
| Positive Test Result | TP | FP | PPV |
| Negative Test Result | FN | TN | NPV |
| Measure | Sensitivity | Specificity | Accuracy = (TP + TN) ÷ (TP + FN + FP + TN) Prevalence = (TP + FN) ÷ (TP + FN + FP + TN) |
High and Low Prevalence
The prevalence of a disease or disorder can change depending on where you are looking for the disease. A disease will have a much higher prevalence in a specialist referral hospital, compared to a primary care setting, which will have a much lower prevalence. Take a look at the example below.
Specialist Hospital
| Diseased in Real World | Non-Diseased in Real World | Measure | |
|---|---|---|---|
| Test (+) | 50 | 10 | PPV = 50/60 = 83% |
| Test (-) | 5 | 100 | NPV = 100/105 = 95% |
| Measure | Sensitivity = 50/55 = 91% | Specificity = 100/110 = 91% |
The prevalence of the disease in this specialist clinic is the number of real cases of disease, divided by the total number of individuals:
- (TP+FN) ÷ (TP+FP+FN+TN) = (50+5) ÷ (50+5+10+100) = 33% prevalence
Primary Care
| Diseased in Real World | Non-Diseased in Real World | Measure | |
|---|---|---|---|
| Test (+) | 50 | 100 | PPV = 50/150 = 33% |
| Test (-) | 5 | 1000 | NPV = 1000/1005 = 99.5% |
| Measure | Sensitivity = 50/55 = 91% | Specificity = 1000/1100 = 91% |
The prevalence of the disease in the primary care setting is the number of real cases of disease, divided by the total number of individuals:
- (TP+FN) ÷ (TP+FP+FN+TN) = (50+5) ÷ (50+5+100+1000) = 3% prevalence
The Take Away Message From This Example
- Sensitivity and specificity of a test are immune to changes in prevalence
- The PPV and NPV of the test does change with the prevalence of a disease
Statistics 101
Data Types
There are a number of different kinds of data:
- Continuous (e.g. - weight, age)
- Dichotomous (e.g. - a yes/no diagnosis, yes/no medications)
- Categorical (e.g. - type of housing [apartment, condo, house])
- Time to event (e.g. - time until death/time until re-hospitalization)
- Time trends (e.g. - rates of hospital visits over time, number of falls per year)
Analysis
For each type of data, there are different univariate and multivariable analytic methods.
- Univariate analysis – compares only two variables or different categories of 1 variable (two means of blood pressure or depressed vs. non-depressed)
- Multivariable analyses – More than one variable is included in the analysis
- Allows for risk adjustment
- Dependent variable = outcome variable
- Independent variables = predictive factors or variables that need to be accounted for (e.g. - to avoid confounding)
Epidemiology Basics
Efficacy vs. Effectiveness
- Efficacy is the extent to which an intervention does more good than harm under ideal circumstances (i.e. - in a clinical trial under strict conditions).
- Effectiveness is the extent to which an intervention does more good than harm when provided under usual circumstances of healthcare practice (i.e. - in a real world setting). Effectiveness studies are also known as pragmatic trials in research studies, due to the pragmatic nature of the research.[3][4]
Mnemonic
The memory aid “Efficacy is aDELICACY” can be used to remember the that efficacy is measured under strict, fancy, expensively run, randomized clinical trial conditions – a “delicacy”!
Critical Appraisal
Once you know the basics of statistics, it is then important to be able to understand how statistics can be misinterpreted and be able to critically appraise the literature!


